Hello I'm
Chezka Siño
Data Analyst
- chezka@pm.me
- +1 (209) 817-4756
- San Francisco Bay Area, CA, United States

Hello, I'm Chezka. I'm a Data Analyst experienced with turning raw data into usable information to help in solving business problems. Previous companies include Salesforce and Academy of Art University.
I am also good at...
A huge part of my interest is presenting data visually using different types of data visualizations. Some of the tools I have used are d3.js, seaborn, matplotlib and Tableau.
I have worked on various data science projects where I have done exploratory data analysis and data mining. I have familiarized myself with various machine learning algorithms.
I have utilized different programming languages in my projects, like Python and R. I have also created websites for some of my projects.

Created and deployed a web application using AWS SageMaker that uses a recurrent neural network (PyTorch) to perform sentiment analysis on movie reviews.
View Project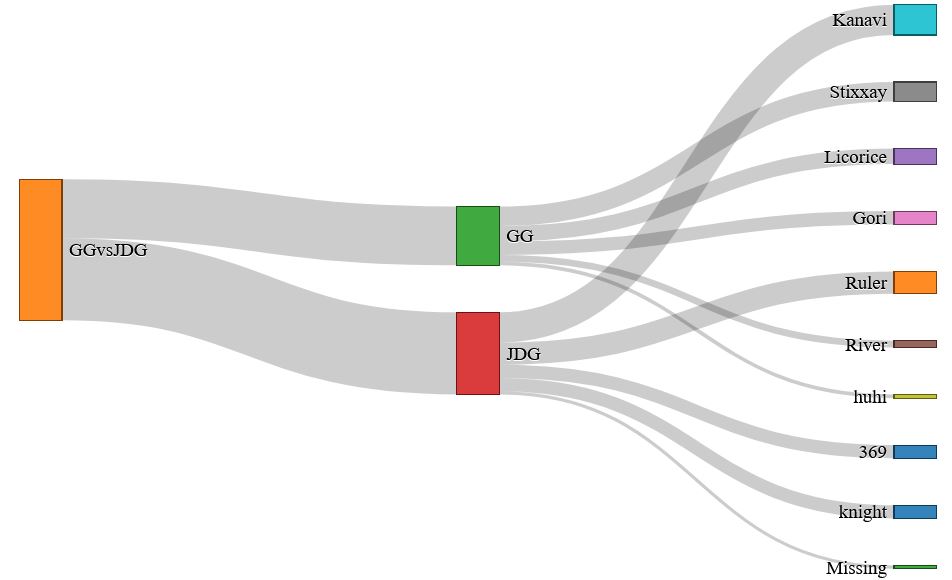
This Sankey diagram created using d3.js visualizes the total damage done to champions of each team and broken down to each player's performance. Data preprocessed using Python with coding time shortened by utilizing ChatGPT.
View Project
Created a MapReduce program that parses unstructured email data and condenses them to a structured database for analysis.
View on Github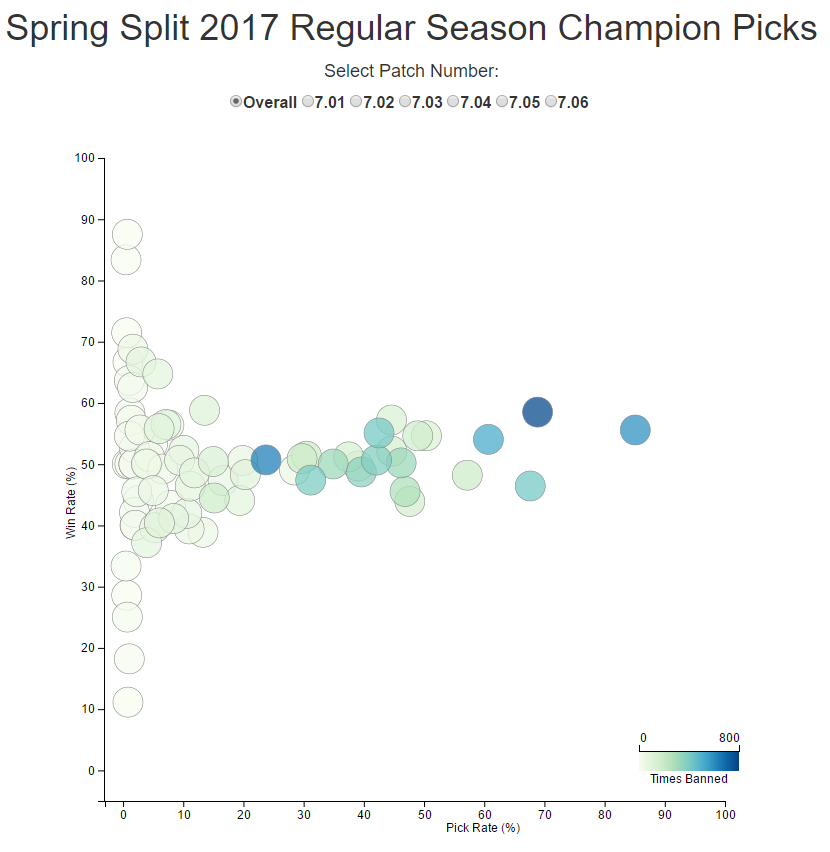
This project has multiple interactive data visualizations that are coded in d3. The visualizations focused on showing the changes in champion diversity in professional League of Legends games from different game patches. The data used is from the games played in different major LoL Esports regions
View ProjectThis Kaggle competition was launched by Italy's Istituto Nazionale di Geofisica e Vulcanologia (INGV) which focuses on geophysics and volcanology. The institute monitors seismic and volcanic activity all over the country.
This project consists of data exploration and pre-processing to ensure that the data would be fit for themodel we would be using for training and predicting. As mentioned previously, our goal is to fit a modelthat would predict the volcano's "time to eruption" based on the sensor data logs from the different sensorson the volcano.

All variations are organized separately so you can use / customize the template very easily.
Processed and analyzed League of Legends Esports champion data using Python to show the drafting frequency of each champion over different game updates. Displayed findings using interactive data visualizations.
Multithreaded Web Server and Single-threaded Client implementation on Python.
This enables the user to run a multithreaded web server that would be able to handle multiple requests concurrently. The client initiates a connection to the server and would display then message status and page content of the requested file..

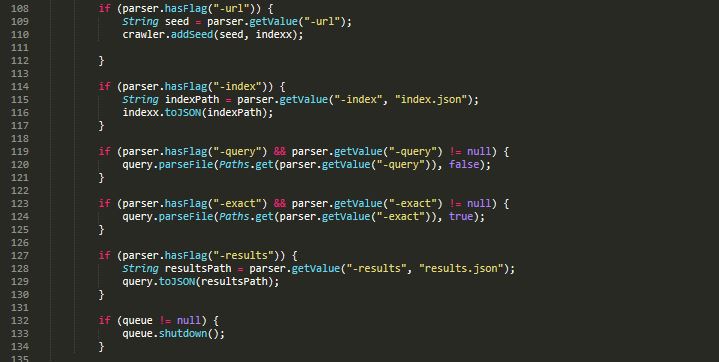
This project crawls through the web and creates and index for different websites for use in a search engine.
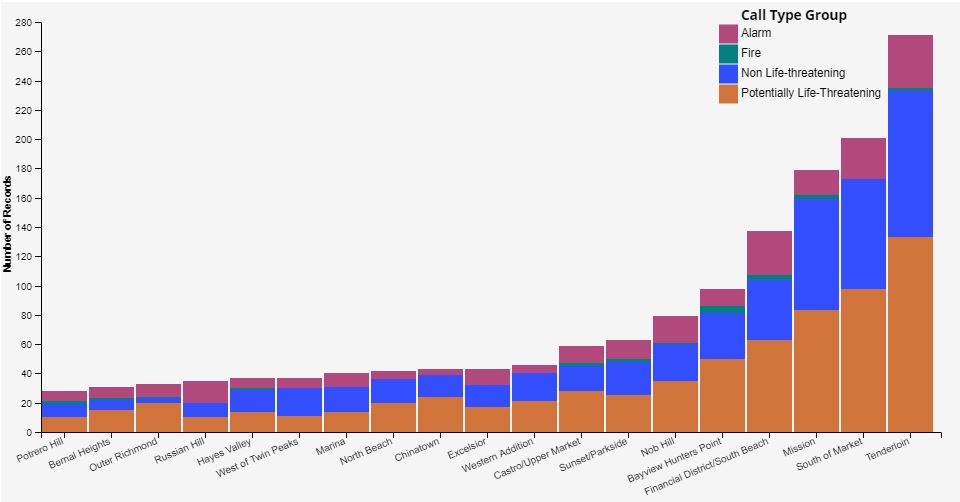
Exploratory data visualizations of Fire Department Calls for Services in San Francisco on December 2016
This data set includes information about 911 calls and fire department call services in San Francisco on December 2016. Each of the 911 calls is recorded with an incident number, time, location, and type. The time given includes the date and time of the day. The location includes an address, zip code, and neighborhood district. The call type includes citizen assist, traffic collision, citizen assist, medical incident,vehicle fire, structure fire, outside fire, fuel spill, gas leak, electrical hazard, elevator, alarms, and others ,which are then group labeled as alarm, non life-threatening, potentially life threatening, and fire.
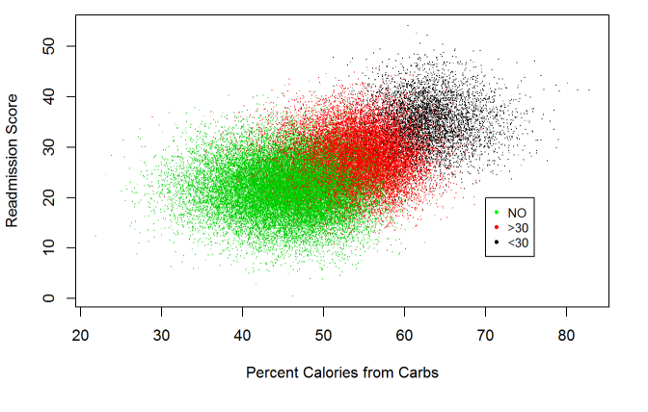
This project focused on simulating the Simpson's paradox in a large scale simulated healthcare dataset. The dataset we worked with was created by reverse engineering admission histories and engineering analytical features from simulated data sources on an existing dataset about hospital readmission rates for diabetic patients. The simulated data sources include grocery purchases and wearable vital sign sensors and were used to engineer features such as percent calories from carbohydrates and minutes spent walking. In order to simulate Simpson's paradox, we extended this dataset by adding a genetic trait to act as a statistical confounder.
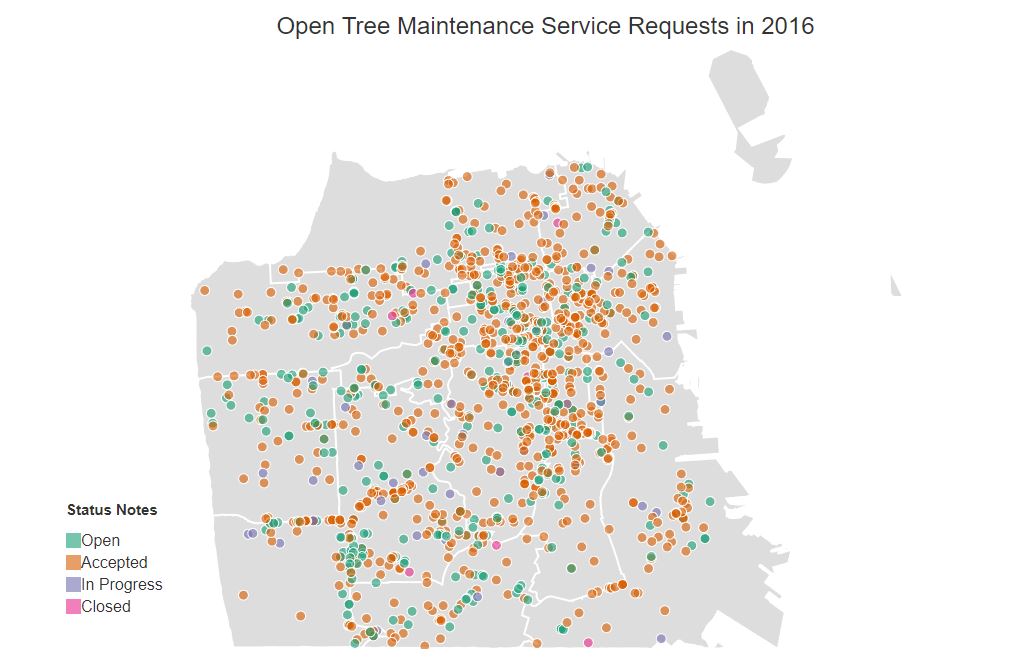
TThe datasets used in this visualization are from SF OpenData - geographical data showing the different supervisorial districts in SF and Tree Maintenance Data.
The data was subsetted to focus on service requests which are still "open". The data is visualized using a Non-Proportional Symbol Map.
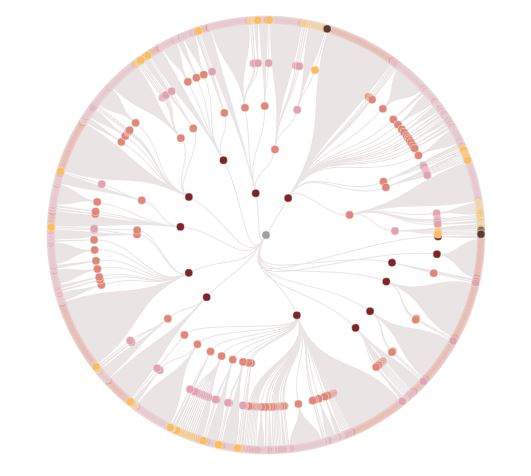
The hierarchical data used for the different visualizations is the Java 8 API hierarchy. The CSV file with the Java 8 hierarchy is from the Java 8 SDK Documentation. Different hierarchical visualization techniques are used to visualize the data.
The different hierarchy visualizations include Traditional Node Layout with Straight Edges, Circular Dendogram Node Layout with Curved Edges, Circle Packing and Treemap
Created and deployed a web application using AWS SageMaker that uses a recurrent neural network (PyTorch) to perform sentiment analysis on movie reviews.
NOTE: Web Application currently not live
Created a MapReduce program that parses unstructured email data and condenses them to a structured database for analysis.
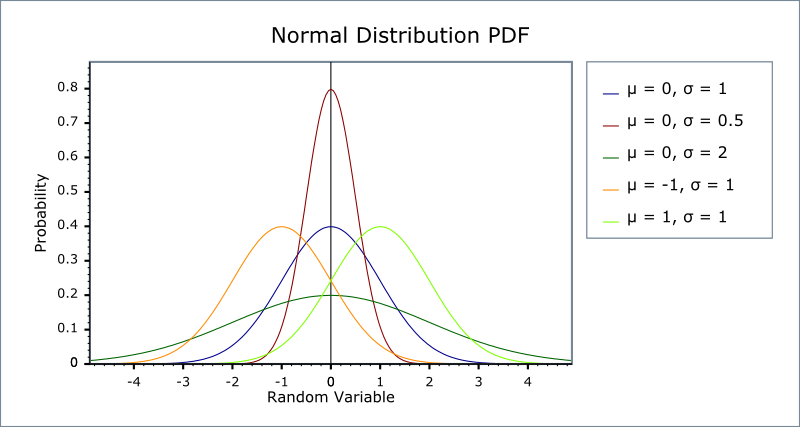
Python package for calculating Gaussian and Binomial distributions.
It is a clean and elegant Multipurpose Landing Page Template. It will fit perfectly for Startup, Web App or any type of Web Services. It has 4 background styles with 6 homepage styles. 6 pre-defined color scheme. All variations are organized separately so you can use / customize the template very easily.

All variations are organized separately so you can use / customize the template very easily.

All variations are organized separately so you can use / customize the template very easily.